The economic environment is changing and advertisers are adapting. They’re pulling ad spend and the focus for most companies is switching from prioritizing growth to efficiency. CMO’s are starting to care more about ROAS and MER and less about total revenue driven.
All this means that agencies will be evaluated differently and optimizing campaigns at every level will be a must. If you’re looking to retain happy clients, it’s time to make sure you’re not leaving any potential performance improvement on the table.
You won’t be optimizing everything on a campaign all the time. There are actually three levels of optimizations you can make to a campaign and each level differs based on how frequently you’ll make each type of optimization.
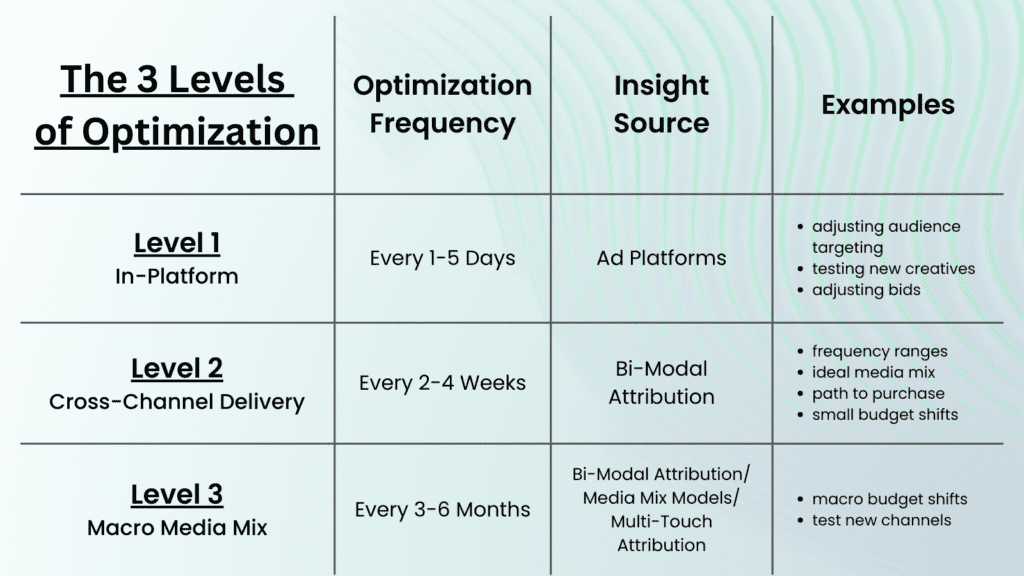
Level 1: In-Platform
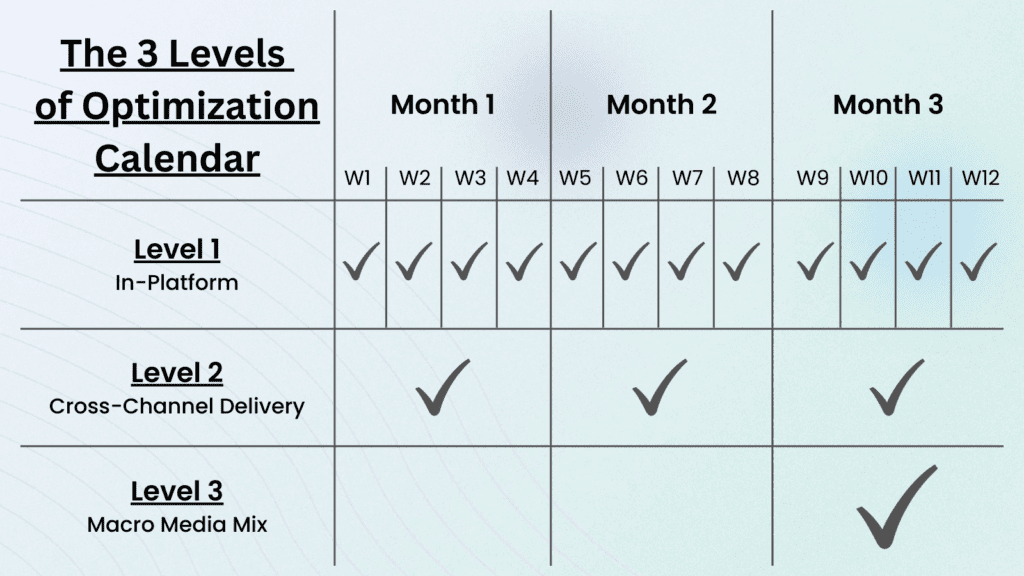
In-Platform optimizations are the most common changes advertisers make to campaigns because they’re the most obvious and the types of improvements you make most frequently. Level 1 optimizations are typically done multiple times a week inside of your ad platforms. These optimizations are things like adjusting audience targeting, testing new creatives, adjusting bids.
The data you need to inform Level 1 adjustments will be inside of the ad platforms you’re using, not 3rd party tools like Google Analytics. You need the level of insight that can help you make granular adjustments.
When you talk to a marketer about optimization, they’ll normally only think about these In-Platform optimizations. They might also consider Level 3 optimizations, but Level 2 almost never comes to mind.
Level 2: Delivery Parameters
Optimizing Delivery Parameters is the least common type of change that marketers deploy. This is normally because the data necessary to drive these insights is unavailable or difficult to find. Level 2 optimizations are done cross-platform, so quality cross-platform measurement is a necessity.
Delivery parameters will normally be optimized every 2-4 weeks. To generate these insights, you might ask questions like:
- How often are users seeing our ads on multiple channels?
- How often are media mixes driving conversions versus a single channel by itself?
- Which specific media mixes have the highest conversion means?
When you’re working at this level, you’re trying to understand how your campaign is delivering across channels and how you can adjust delivery parameters to be more efficient? You’ll keep an eye out for things like time of day, day of week, which channels are reaching or converting a lot of incremental users.
You might find a channel that’s reaching a lot of new people, but it’s struggling to convert them. That’s when you can pair that channel with another to increase conversion rates.
Level 2 boils down to trying to adjust how your campaign is delivering in the short term or medium term to drive better longer term results. These optimizations will look like small budget changes across channels to reduce waste and improve efficiency or scale.
Level 3: Big-Picture Media Mix
Regularly doing Level 1 and Level 2 analysis gives you the data you need to execute Level 3. These Big-Picture Media Mix Optimizations are the least frequent, done 2-4 times per year.
You start this analysis by stepping back to look across the quarter and asking:
- What consistently has done well this quarter?
- What consistently struggled?
- What drove overall success?
- Where are you less efficient?
This isn’t exactly the same as a postmortem on your campaign, but you are taking a similar high-level view. If you do this well, you’ll produce insights like, “video played a really key role in the media mix. It really struggled to convert incremental new users, but does a great job of supporting conversion rates. Based on this we allocated a little bit too much money to video based on what we need to drive optimal cross-channel delivery.”
When you decide to reduce overall video investment for the quarter by 10% and reallocate that to remarketing and native, the data that supports these changes comes from the past 3 months of analysis you’ve been doing at Levels 1 and 2.
These types of optimization might sound similar to Level 2 and the difference is that you’re looking at trends that become clear only after several months that aren’t noticeable from month to month. When you’re analyzing every week or month, performance can be impacted by factors outside your control – things like the economy or the weather, or anything else that might change how people buy. When you analyze 3-6 months’ worth of data, you normalize for these variants and can get a better understanding of each tactic’s consistency.
When you’re analyzing you’re big-picture media mix, you should also evaluate your user journey. You need to understand like how long does it take to sell your product. How many ads, over what time period drives the best conversion rates and highest quality conversions?
Level 3 is all about taking a longer perspective, reviewing the user journey, understanding what’s consistently working and what’s consistently delivering results. Then based on the insights you find here, you’ll be making bigger budget changes and allocations.
The Key to Unlocking Uncommon Performance
Most marketers are already operating at Level 1 and Level 3 – these are very common. The key to unlocking uncommon results is executing Level 2 optimizations to improve your delivery parameters.
You can only optimize Facebook or your DSP so much. Once you’ve got the right copy or the right creative, there’s only so much more you can do to improve. If you operate in-platform effectively, you might improve conversion rates to an extent, but the next level of results requires you to go cross-platform.
The way to unlock the next level of performance is to start adjusting delivery parameters to, for example, build cross-channel frequency that can get you beyond what’s possible in platforms alone.
In our analysis, we see two meta trends around the opportunity to improve delivery parameters: first, most users only see a single impression; and second, conversion rates are almost always higher at a 2+ frequency. The 2+ frequency users normally will convert at a higher rate if those impressions happen in multiple channels as well.
This means that advertisers have a huge opportunity to improve conversion rates by increasing frequency and building cross-channel frequency.
When we analyze campaigns, we see that normally, less than 10% of conversions saw ads in more than one channel. It’s not uncommon for us to see conversion rates increase 3-10x when these Level 2 optimizations are made.
Make Sure You Spend Time At Each Level
Each of the three levels of data analysis are important for consistent performance improvement. Every level is a different way of looking at your data and a way to find opportunities for optimization.
- Level 1 is where you’re working in platform every week to make improvements.
- Level 2 is where you adjust delivery parameters each month to unlock higher conversion rates
- Level 3 makes larger optimizations to your overall media mix and budget allocations.
Spending time operating at each level is crucial if you want to get the most out of your campaigns.